
Command center
In short
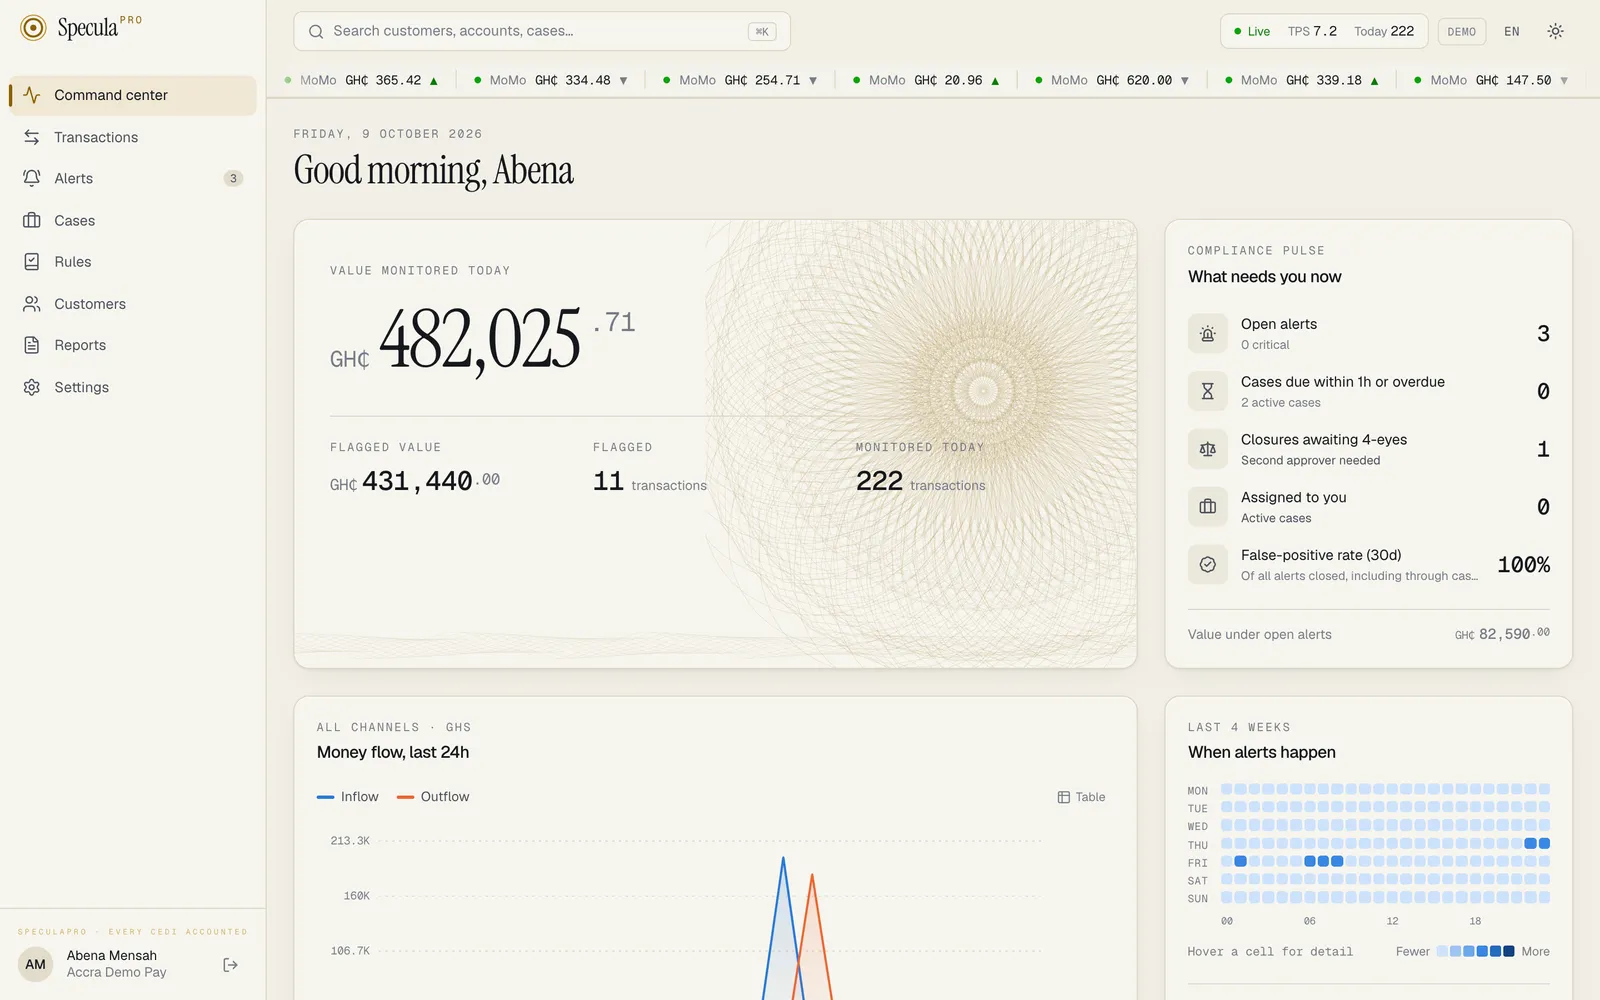
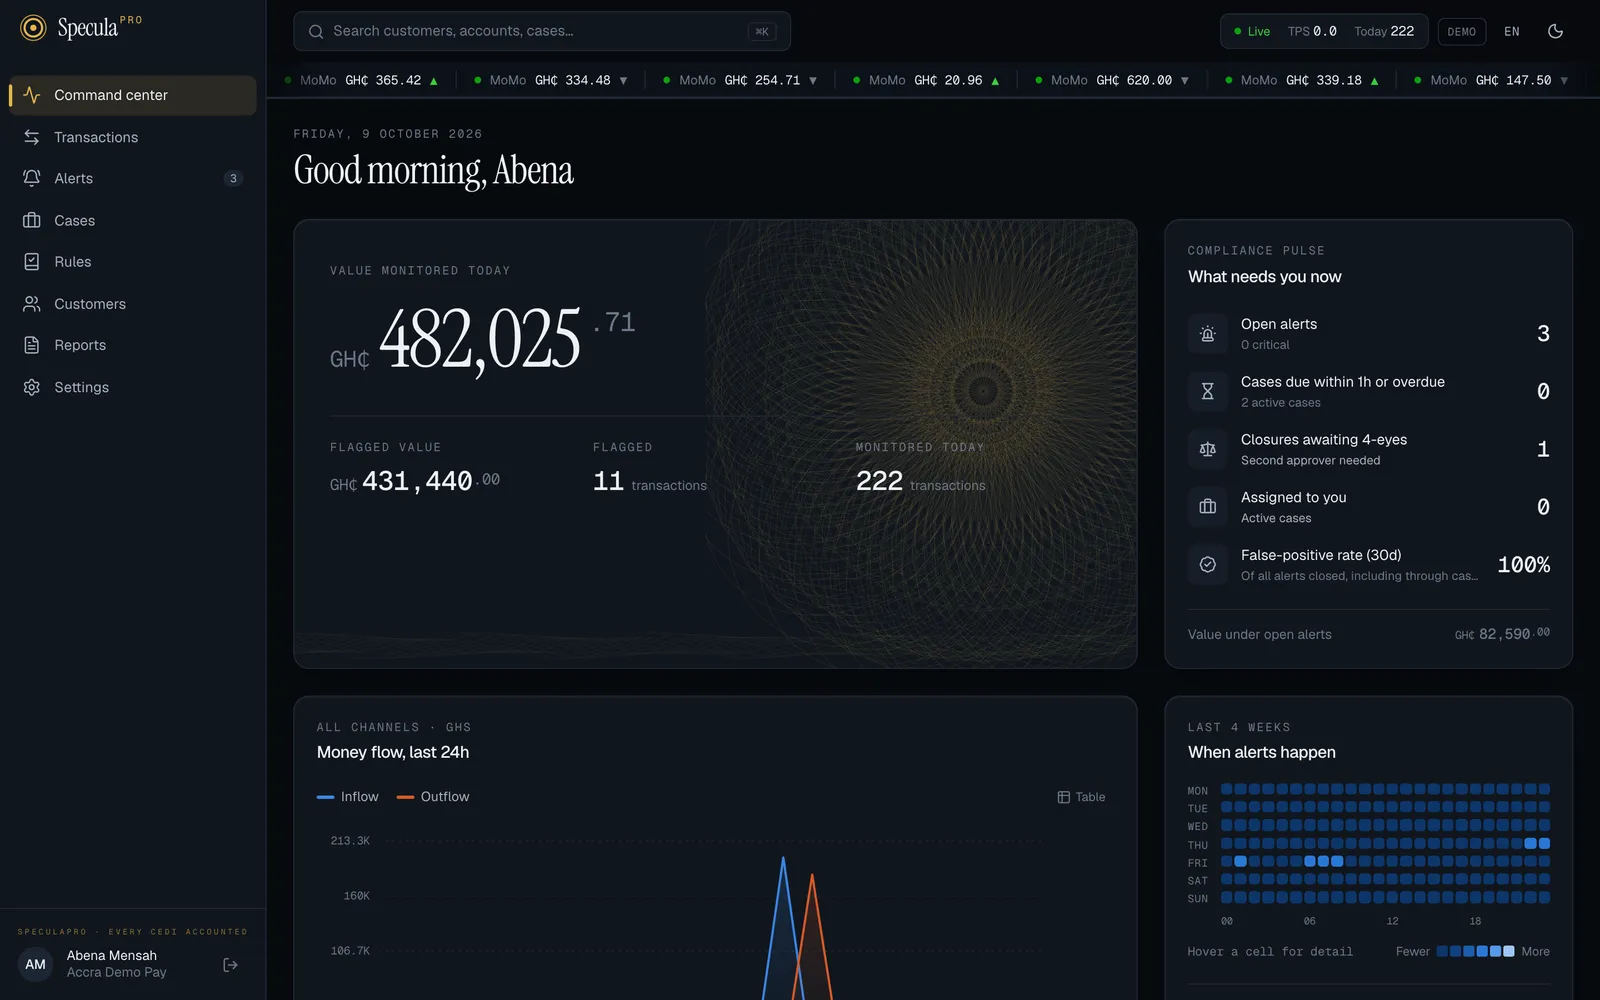
Section titled “In short”The Command center is the first page you see after signing in. It greets you by name and answers two questions: what needs me now? and what is happening in our money flows today?
Every panel shows your workspace’s live data. There is no sample data on this page.
| Panel | What it tells you |
|---|---|
| Value monitored today (the large figure at the top) | How much money SpeculaPro has monitored since midnight, and how much of it was flagged |
| What needs you now | Five counts of work waiting for you or your team, each a shortcut |
| Real-time decisions (a strip, once your payment systems use the decision API) | How many payments were allowed, blocked and held in the last 24 hours, how fast, and whether any were degraded |
| Money flow, last 24h | Money in and out, hour by hour |
| When alerts happen | Which days and hours produce alerts, over the last four weeks |
| Latest transactions | The twelve most recent transactions, flagged or clear |
| Priority queue | The six riskiest open alerts |
| Waiting for a second approver | Case closures waiting for someone to approve them |
| Rule performance | Which rules fire most, and how often their alerts turn out to matter |
What you see depends on your role. If your role can’t view alerts (by default the Administrator), several panels are replaced or empty; see For administrators.
How to open it
Section titled “How to open it”Select Command center at the top of the menu. It is also the page SpeculaPro opens after you sign in.
The top bar: Live, TPS and Today
Section titled “The top bar: Live, TPS and Today”On every page, the top bar shows a small live meter (on wider screens only):
| Item | Meaning |
|---|---|
| Live | SpeculaPro is receiving figures for this meter |
| TPS | Transactions received per second, averaged over the last minute. A quiet workspace often shows a small number such as 0.4 |
| Today | Transactions monitored since midnight, the same figure as Monitored today below |
Under the top bar, a ticker scrolls through the latest transactions: the channel, the amount, ▲ for money in or ▼ for money out, and flagged in amber when a rule fired on it. A green dot means clear and an amber dot means flagged. The ticker pauses while your mouse is over it, and stays still if your computer is set to reduce motion.
The meter and the ticker only appear for roles that can view alerts.
Value monitored today
Section titled “Value monitored today”The large panel at the top summarises today’s monitoring.
| Label | What it counts |
|---|---|
| Value monitored today | The total value of today’s completed transactions, money in plus money out, in your workspace’s base currency. Foreign-currency transactions are converted at the rate recorded when they arrived |
| …% vs. same time last week | How today’s value so far compares with the same part of the day exactly one week ago. Green with ▲ when higher, grey with ▼ when lower. It doesn’t appear when there was nothing to compare with last week |
| Flagged value | The total value of today’s transactions on which at least one live rule fired |
| Flagged | How many of today’s transactions a live rule fired on |
| Monitored today | How many completed transactions happened today |
What needs you now
Section titled “What needs you now”The panel headed Compliance pulse · What needs you now lists five counts. Select any row to jump to the screen behind it.
| Row | What it counts | The small line underneath | Selecting it opens |
|---|---|---|---|
| Open alerts | Alerts nobody has dismissed or put into a case yet | How many of them are critical (shown in red when there are any) | Alerts |
| Cases due within 1h or overdue | Cases that aren’t closed and whose deadline is less than an hour away or already passed | How many active cases there are in total | Cases |
| Closures awaiting 4-eyes | Cases whose closure has been proposed and is waiting for a second person | “Second approver needed” | Cases |
| Assigned to you | Active (not closed) cases where you are the owner | “Active cases” | Cases |
| False-positive rate (30d) | Of all alerts closed in the last 30 days, the percentage closed as false positive | “Of all alerts closed, including through cases” | Alerts |
When open alerts exist, a line under the rows shows Value under open alerts: the total value, in your workspace’s base currency, of the transactions behind all open alerts.
Real-time decisions
Section titled “Real-time decisions”If your payment systems use the real-time decision API, a strip of five figures appears under What needs you now. It covers the last 24 hours and refreshes every 30 seconds. It doesn’t appear until there has been at least one decision in that time.


| Figure | What it counts | The small line underneath |
|---|---|---|
| Decisions · 24h | Every decision made | The share allowed |
| Blocked | Decisions answered block (in red when there are any) |
Their share of all decisions |
| Held for review | Decisions answered review |
How many were answered step_up |
| Latency p99 | 99 in every 100 decisions were answered within this time, on the server | The median (p50) |
| Degraded | Decisions answered by the failure policy because the checks couldn’t finish (amber when there are any) | All checks ran, or Failure policy answered |
The figures in the picture come from a demonstration workspace. Select anywhere on the strip to open the Decisions page.
Money flow, last 24h
Section titled “Money flow, last 24h”The chart headed All channels · GHS (your base currency) · Money flow, last 24h draws two lines, one point per hour for the last 24 hours:
- Inflow: money received by your customers,
- Outflow: money they sent.
Only completed transactions count, converted to your base currency. Move your mouse along the chart to see both figures for a given hour.
How to read the figures as a table
Section titled “How to read the figures as a table”- Select Table at the top right of the panel. The chart is replaced by a table with one row per Hour and columns for Inflow and Outflow.
- Select Chart to switch back.
The table is also the easiest way to read the figures with a screen reader.
When alerts happen
Section titled “When alerts happen”The panel headed Last 4 weeks · When alerts happen is a grid with one row per weekday (MON to SUN) and one column per hour (00 to 23). Each cell is coloured by how many alerts started in that hour over the last 28 days: the legend runs from Fewer (pale) to More (dark).
- Hover over a cell to read it: the line under the grid changes from Hover a cell for detail to, for example, Fri 02:00 · 4 alerts.
- Busiest hour names the single weekday and hour with the most alerts, and how many.
- Overnight share is the percentage of alerts that started between 00:00 and 04:59, when nobody is watching.
An alert is placed at the time of its first rule hit, in your workspace’s time zone. If there were no alerts at all in the last four weeks, the grid stays pale, Busiest hour reads No alerts in the last 4 weeks and Overnight share shows a dash.
Latest transactions
Section titled “Latest transactions”The panel headed Refreshes every 10 s · Latest transactions lists the twelve transactions SpeculaPro received most recently, newest first.
| Column | What it shows |
|---|---|
| Time | When the transaction happened, to the second |
| Customer · Counterparty | Your customer’s name, and underneath ← from or → to the other party. Shown as — if your role can’t view customers (see below) |
| Channel | For example Mobile money, Bank transfer or Card |
| Amount | In the transaction’s own currency |
| Risk | A small meter with the highest score of any rule that fired, and underneath the library keys of those rules (for example A1 · G3) |
| Monitoring | Flagged (amber) when a live rule fired, Clear (green) when none did |
When nothing has arrived yet it says No transactions yet. They appear here seconds after your systems send them.
Priority queue
Section titled “Priority queue”The Priority queue panel (headed Highest risk first) shows the six riskiest open alerts, in the same order and format as the alert queue. Select one to open it, or select Open the full queue to see them all.
When there is nothing to review it says No open alerts. The queue is clear.
Waiting for a second approver
Section titled “Waiting for a second approver”The panel headed Maker–checker · Waiting for a second approver lists up to six cases whose closure is awaiting approval. Each line reads, for example:
| Label | Text | On the right |
|---|---|---|
| Case closure | Close SP-2026-000123 as report filed · Kwame Asante | Efua Owusu · 2h ago |
Reading left to right: the case number, the proposed outcome and who the case is about; then, on the right, who proposed the closure and how long ago. (Names are illustrative.) If you proposed it yourself, (you) appears after your name: you can’t approve your own proposal.
Select a line to open the case and approve it or send it back. When nothing is waiting, the panel says Nothing is waiting for approval.
This panel needs cases.view.
Rule performance
Section titled “Rule performance”The panel headed Last 30 days · hits · Rule performance shows up to eight running rules, those with the most hits first. Each row shows the rule’s library key (for example A1), its name, the number of hits in the last 30 days (shadow tests excluded) and a bar comparing it with the busiest rule.
Hover over a row for the second figure:
- 12 hits · 40% of 5 closed alerts confirmed, or
- no closed alerts yet.
Confirmed here means: of the alerts this rule contributed to that were closed in the last 90 days, the share that were not closed as false positive. Alerts dismissed as no action needed or duplicate, and alerts closed together with their case, count as confirmed.
When no rule is running, the panel says No rules running yet.
How fresh the figures are
Section titled “How fresh the figures are”| Panel | Refreshes |
|---|---|
| Value monitored today, Money flow, When alerts happen, Latest transactions, Rule performance, the top-bar meter and the ticker | Every 10 seconds |
| What needs you now, Priority queue, Waiting for a second approver | Every 30 seconds, and straight after you act on an alert or case |
| Real-time decisions | Every 30 seconds |
You don’t need to reload the page.
For administrators
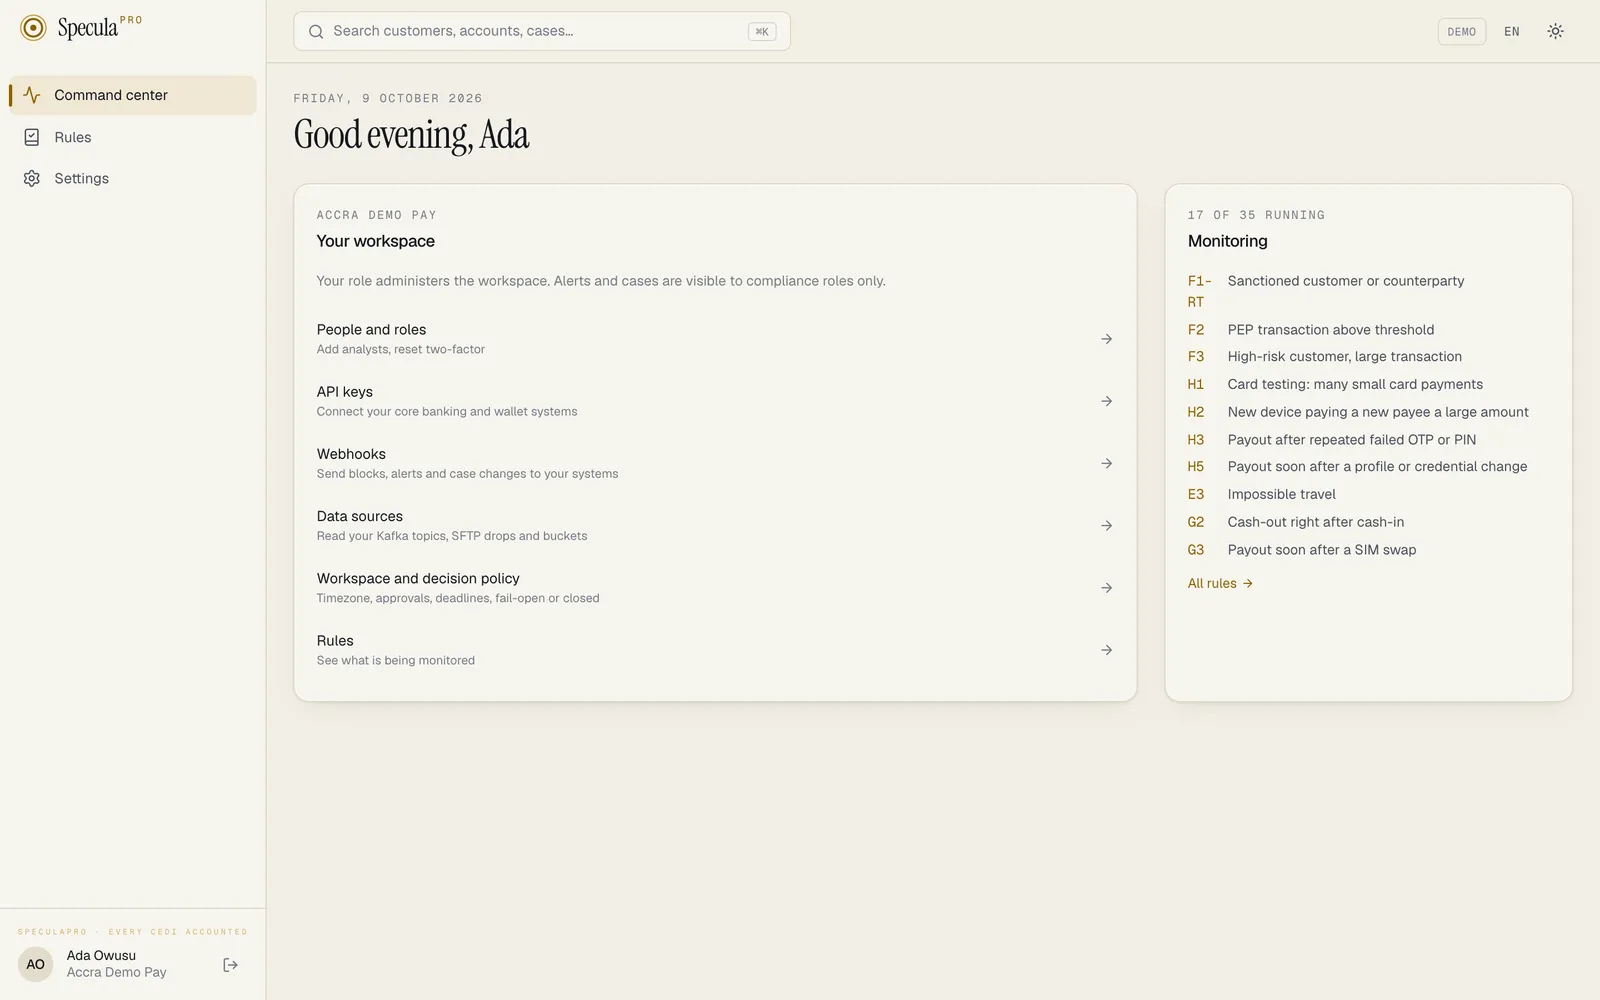
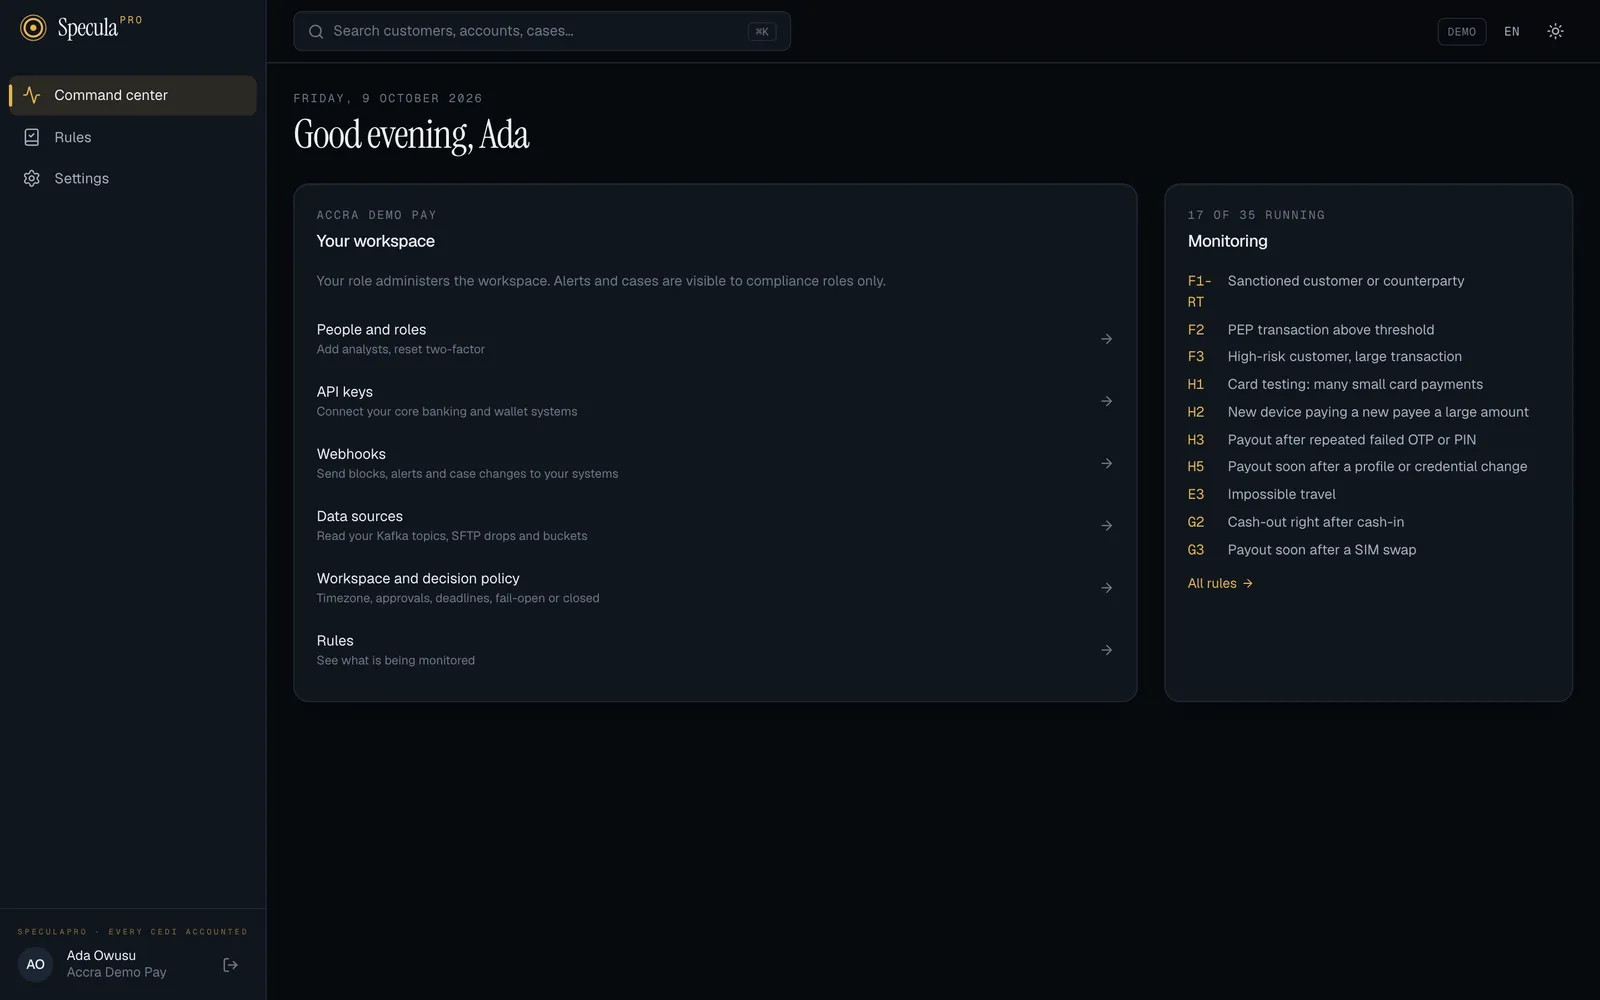
Section titled “For administrators”Roles that run the workspace rather than investigate see a Your workspace panel, headed with your workspace’s name, instead of the compliance pulse. It explains Your role administers the workspace. Alerts and cases are visible to compliance roles only. and links, depending on your permissions, to:
- People and roles: Add analysts, reset two-factor, which opens Settings on the People tab,
- API keys: Connect your core banking and wallet systems, which opens Settings on the API keys tab,
- Webhooks: Send blocks, alerts and case changes to your systems, which opens Settings on the Webhooks tab,
- Workspace and decision policy: Timezone, approvals, deadlines, fail-open or closed, which opens Settings on the Workspace tab,
- Rules: See what is being monitored.
Next to it, a Monitoring panel lists the rules that are running, each with its library key and name (for example A1 Large single transaction). Its heading counts them, for example 17 of 35 running, and All rules opens the Rules library.
That is all an administrator sees on this page: the money figures, charts, queues and latest transactions come from your customers’ activity, which the Administrator role deliberately can’t view. The top-bar meter, the ticker and the real-time decisions strip are hidden too. To see monitoring figures, sign in with a compliance role.
What administrators do from here is covered in Administering a workspace.