
Analytics
In short
Section titled “In short”The Analytics page shows how your monitoring has moved month by month: how much money you monitored and through which channels, which kinds of rule fired, which rules produced alerts worth having, how alerts ended, and what the real-time decisions answered.
The Command center answers what is happening today? Analytics answers what has changed over the year? It is the page to open before a board report, a regulator’s inspection or a rule-tuning session.
Every figure is your workspace’s own data. Nothing is sampled or estimated.
| Where | Analytics in the sidebar |
| Who sees it | Anyone with alerts.view. By default that is every compliance role; the Administrator role doesn’t have it |
| How far back | Up to 24 months when your installation has the analytics store and your workspace’s history has been copied to it; the last 3 months otherwise. The page always says which, and why. See How far back you can look |
| How fresh | Usually within a minute or two of live. The page doesn’t refresh by itself: reload it to see newer figures |
| Months | Calendar months in your workspace’s time zone, the current month included. They are exact in every time zone, including those on a half-hour or quarter-hour offset such as India, Nepal and Newfoundland |
How to read the page
Section titled “How to read the page”- Open Analytics in the sidebar.
- At the top right, choose 3 months, 6 months, 12 months or 24 months. The page opens on 12. The pressed button is always the period you are actually looking at: if 12 months can’t be shown, the page shows the longest period that can, and presses that button instead. A period that can’t be shown right now is greyed out; rest the pointer on it to see why.
- Read the line under the title. It says where the figures were read from, how many months they cover and, when longer periods aren’t available, the reason.
- Hover over any bar to see that month’s figures, series by series, with the total.
- Select Table above a chart to see the same figures as a table, one row per month. Select Chart to go back.
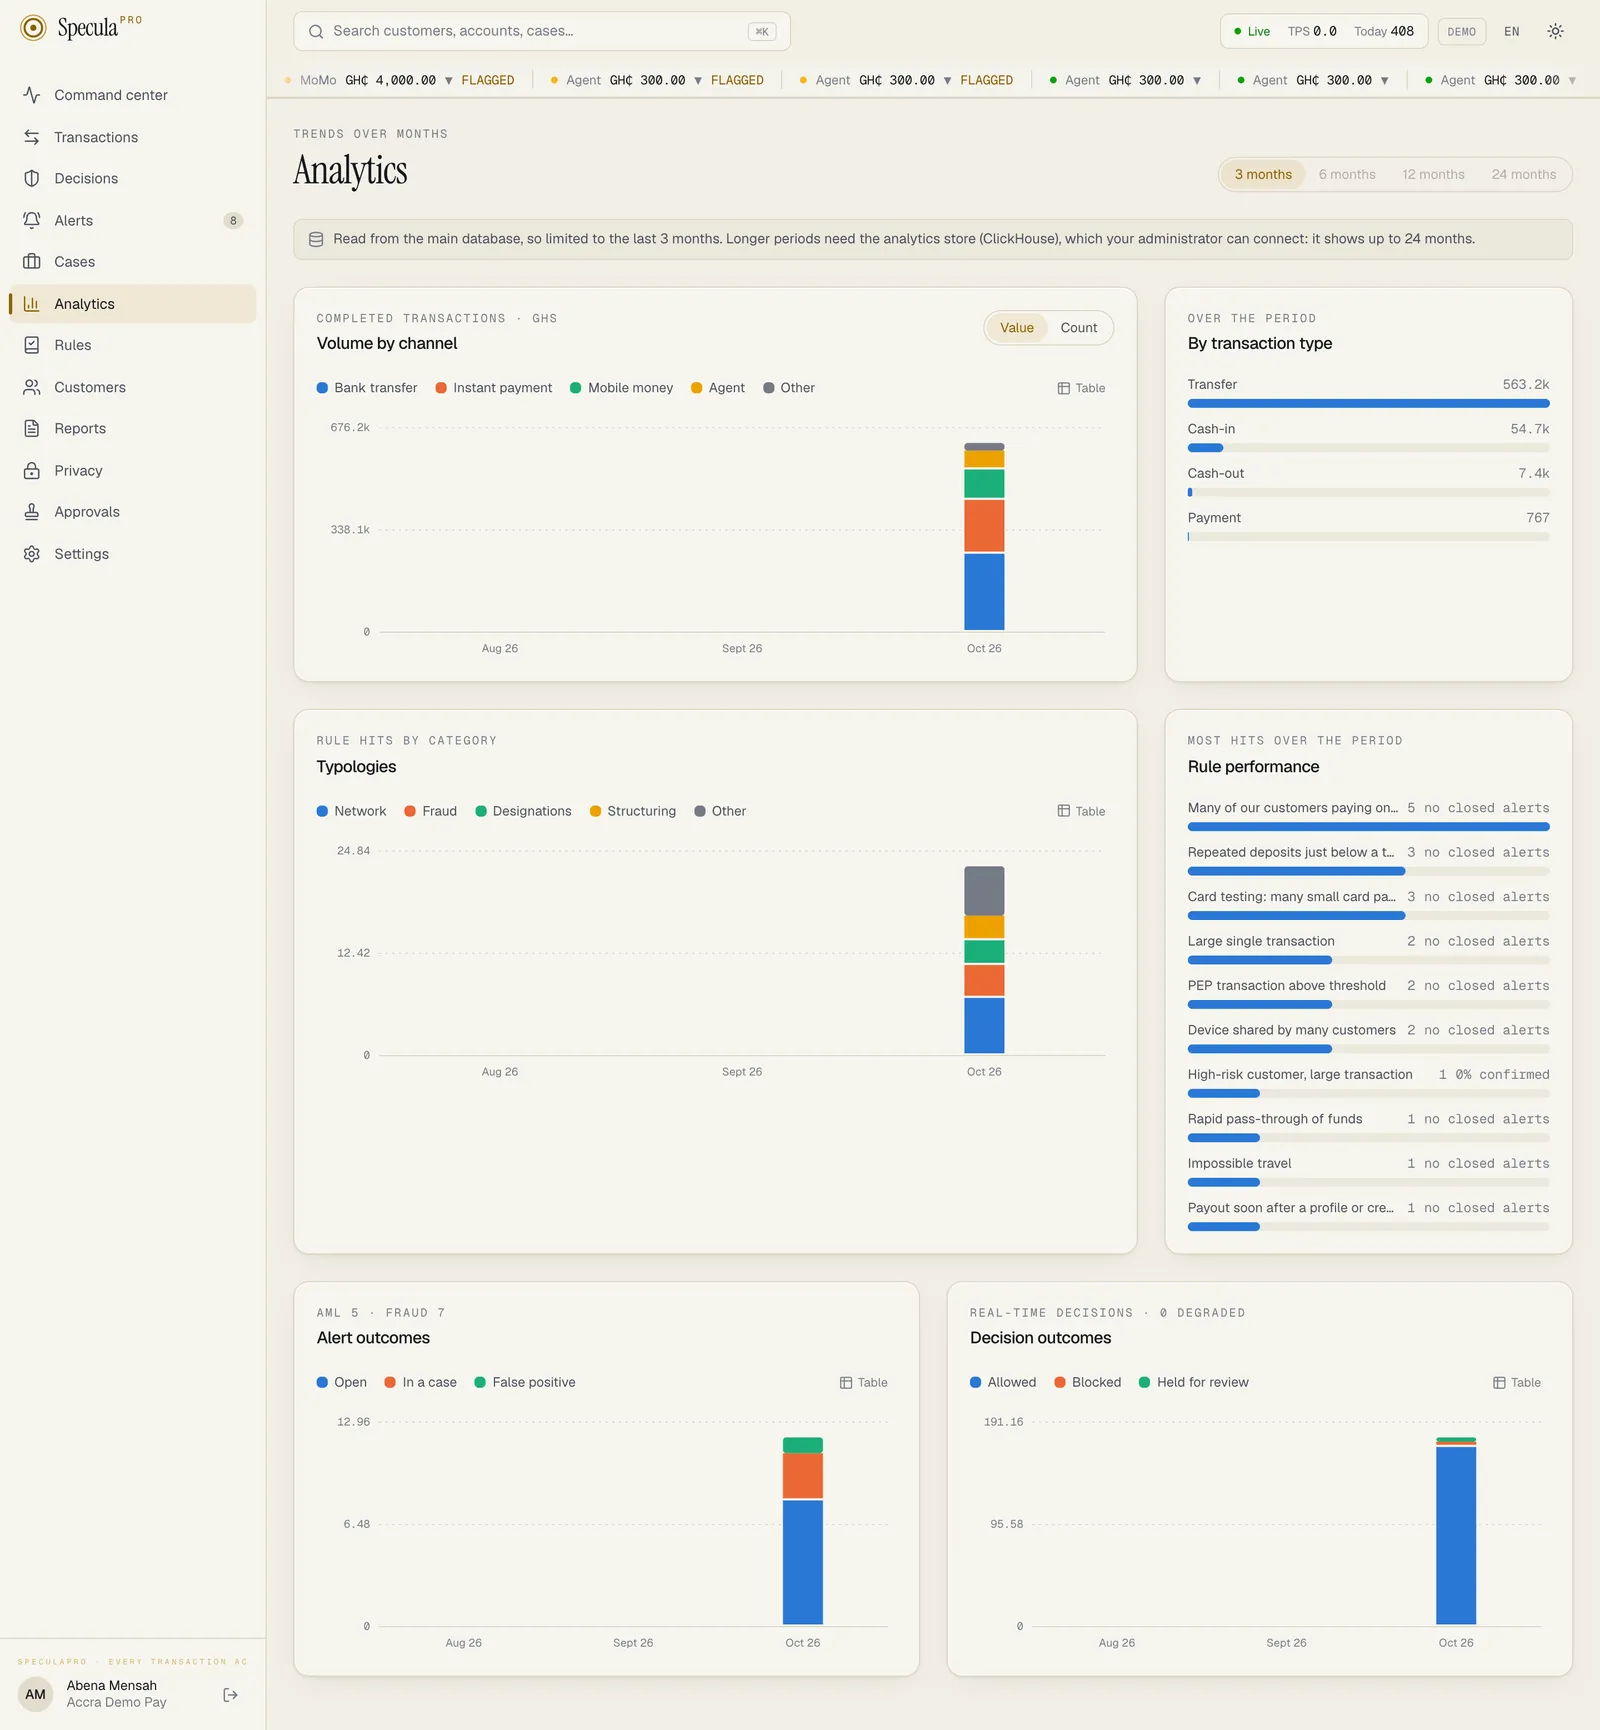
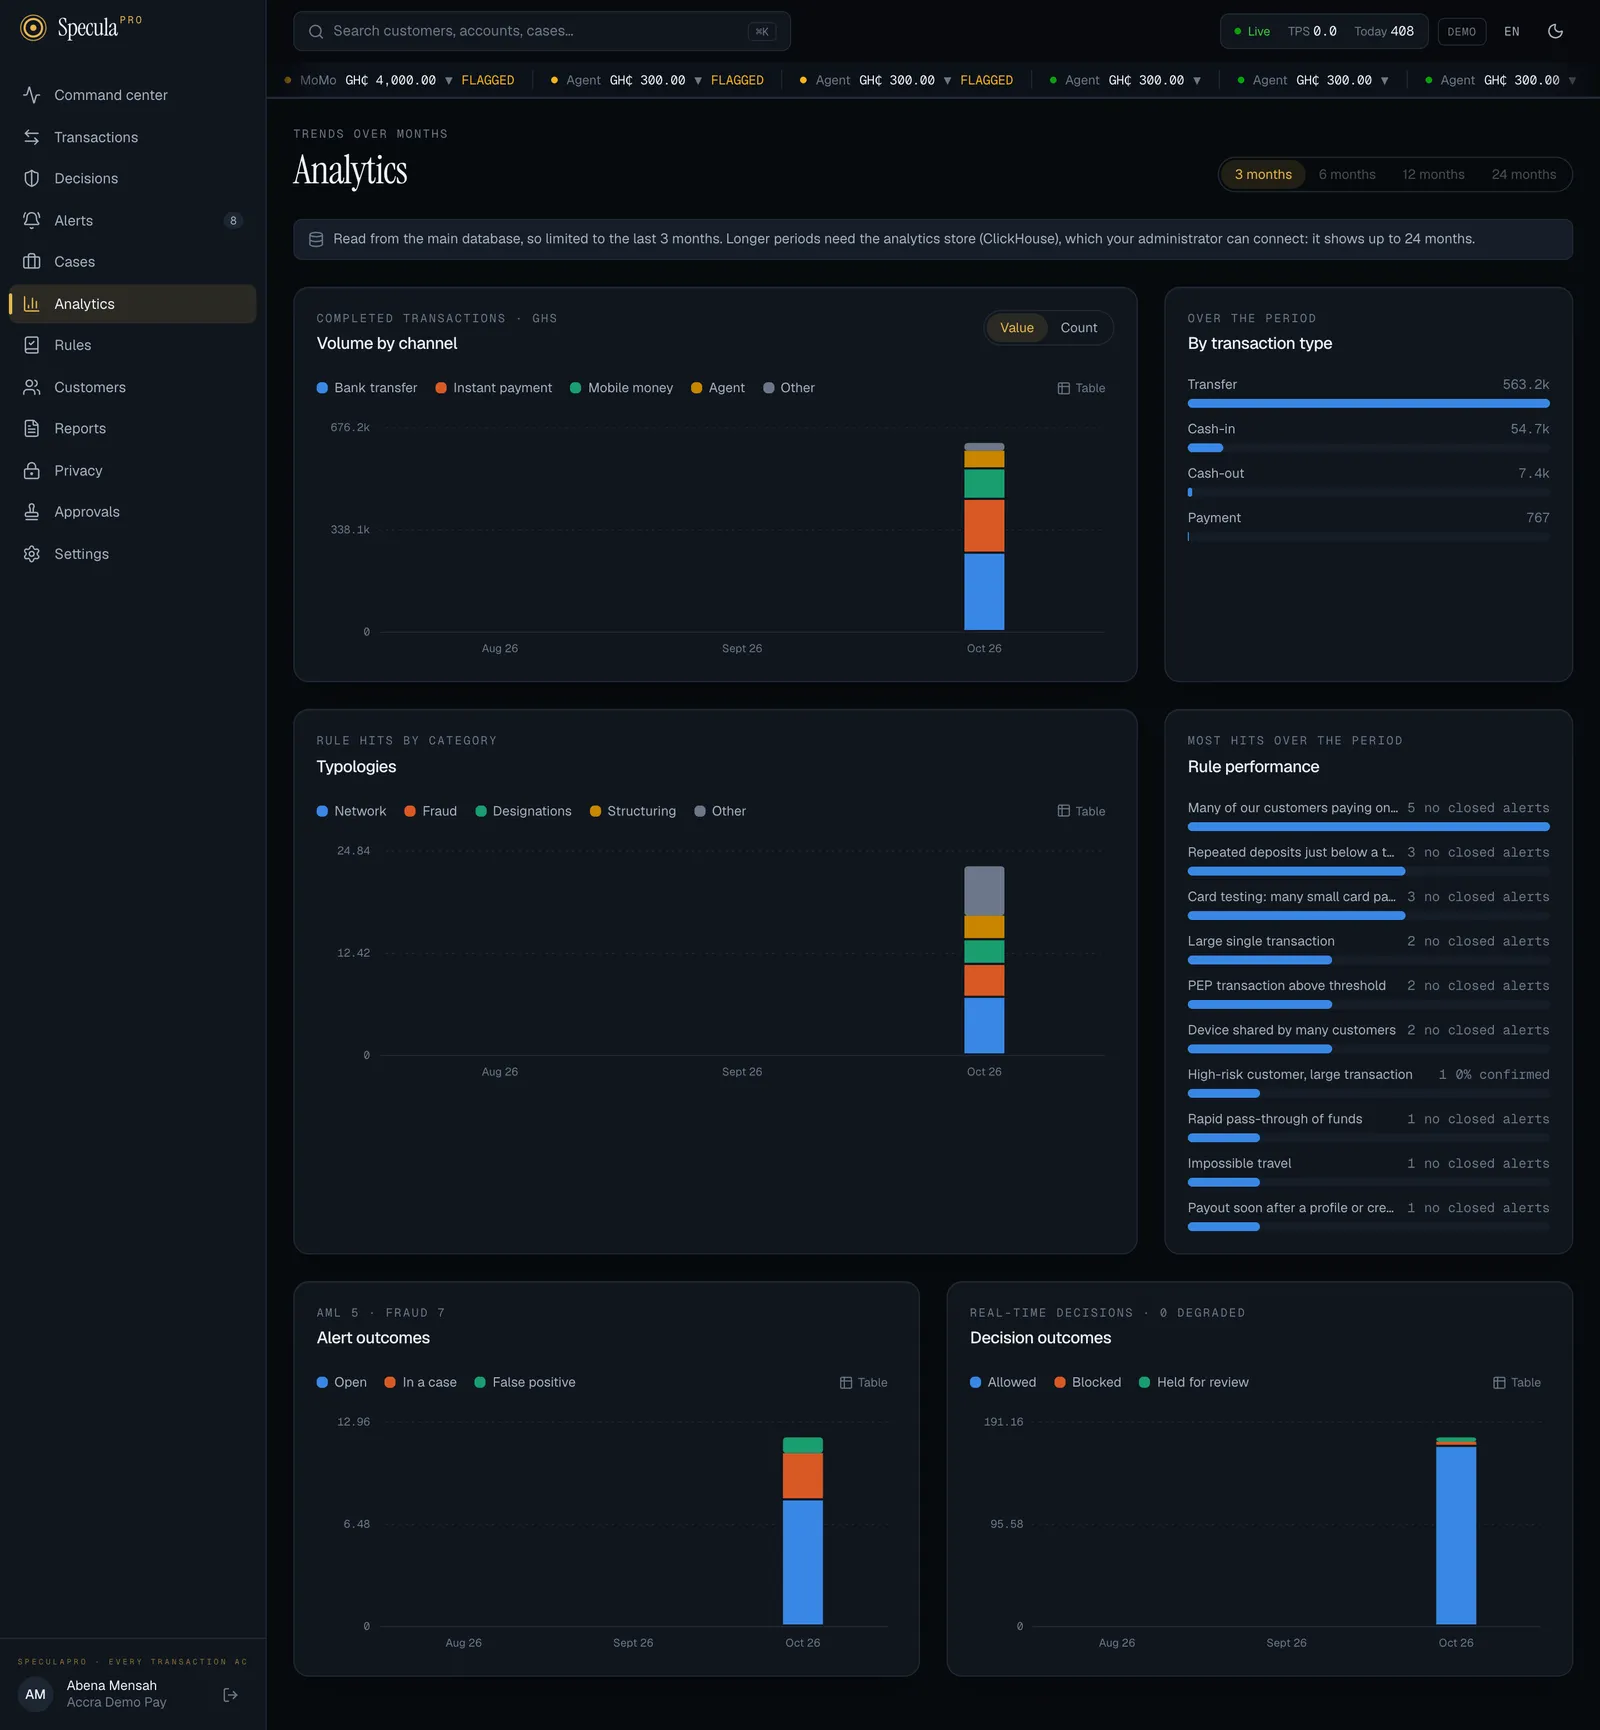
Each chart shows at most four named series plus Other, largest first over the whole period. Everything outside the four largest is added together as Other, so a chart stays readable however many channels or categories you have. The table view uses the same grouping.
The panels
Section titled “The panels”Volume by channel
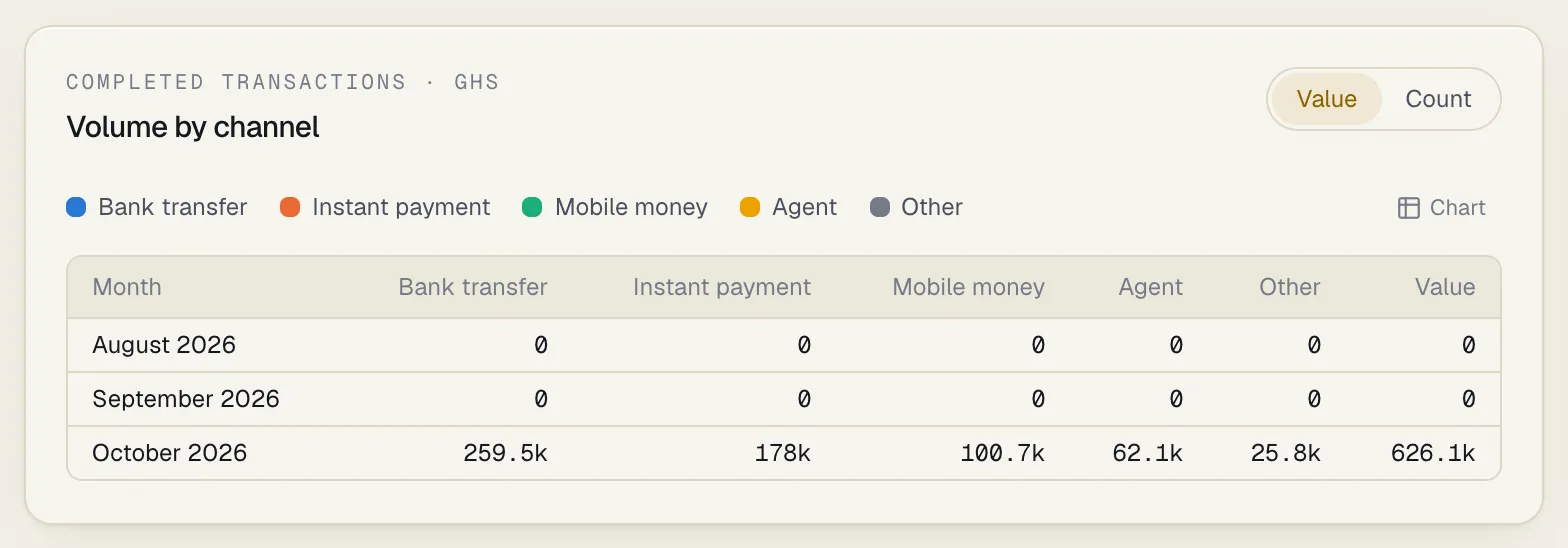
Section titled “Volume by channel”Completed transactions per month, stacked by channel (mobile money, bank transfer, card and so on). Pending, failed, reversed and blocked transactions aren’t counted.
Use Value and Count at the top of the panel to switch between the money moved, in your base currency, and the number of transactions. Foreign-currency transactions are converted at the rate recorded when they arrived.
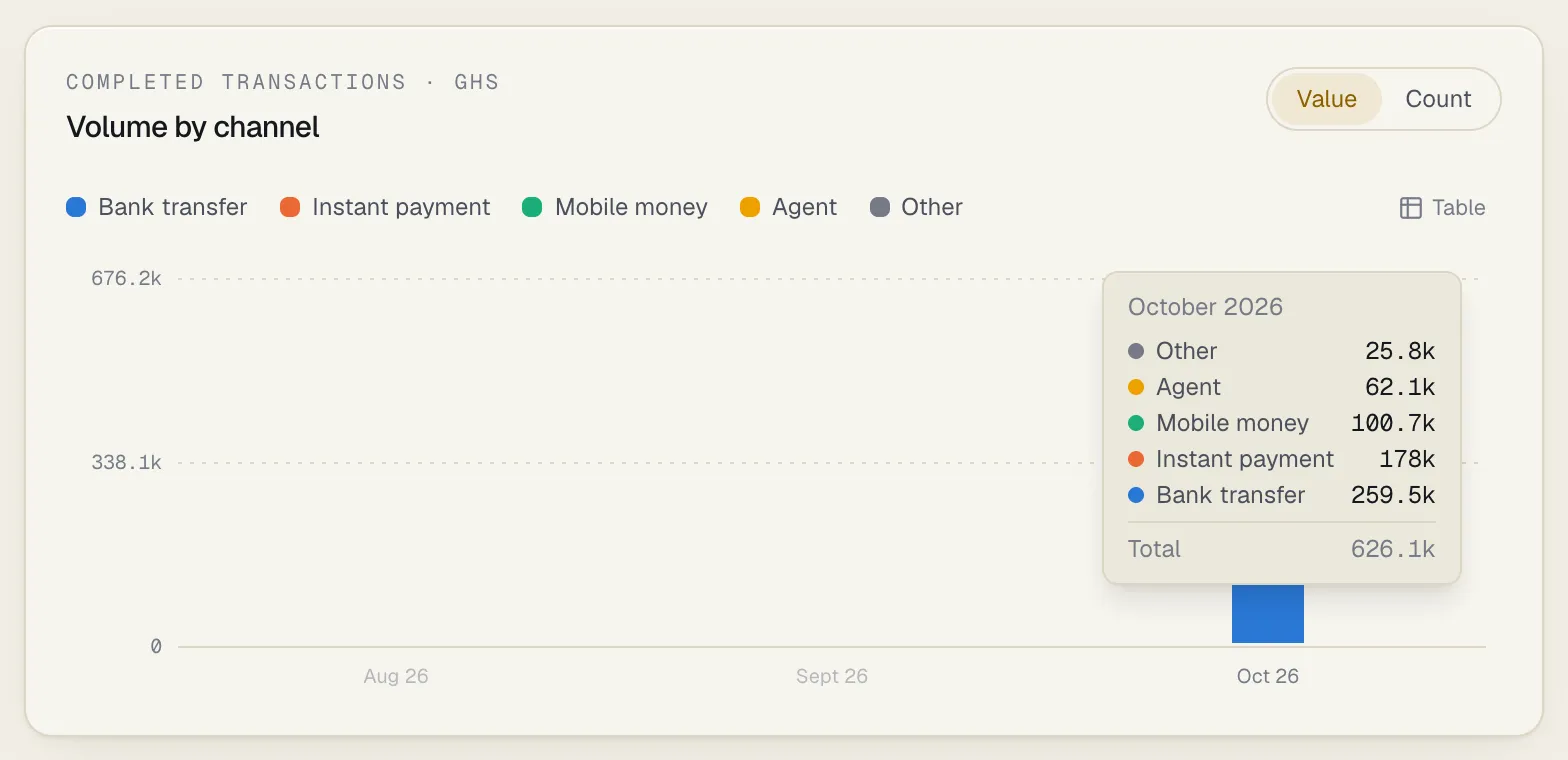
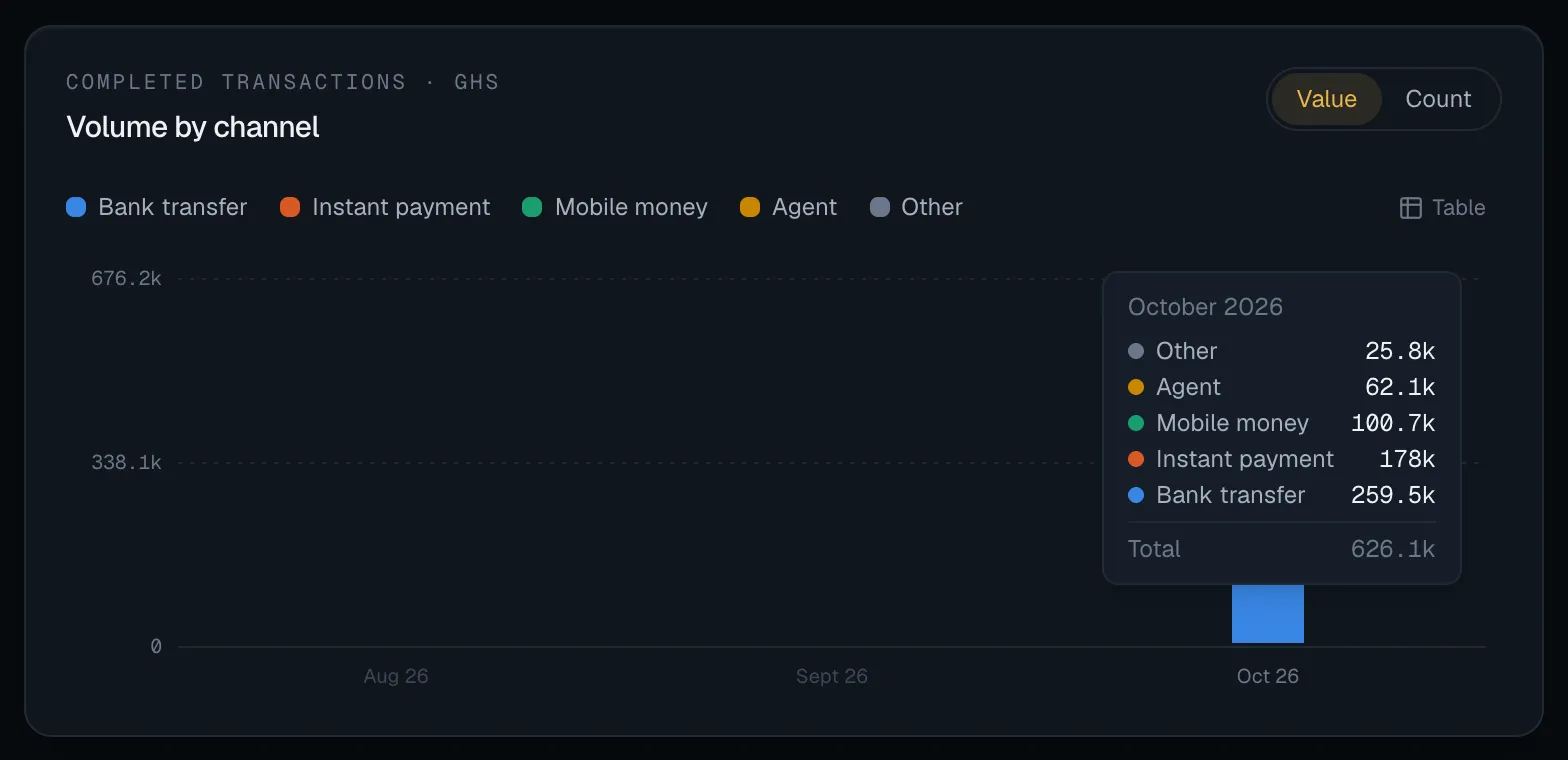
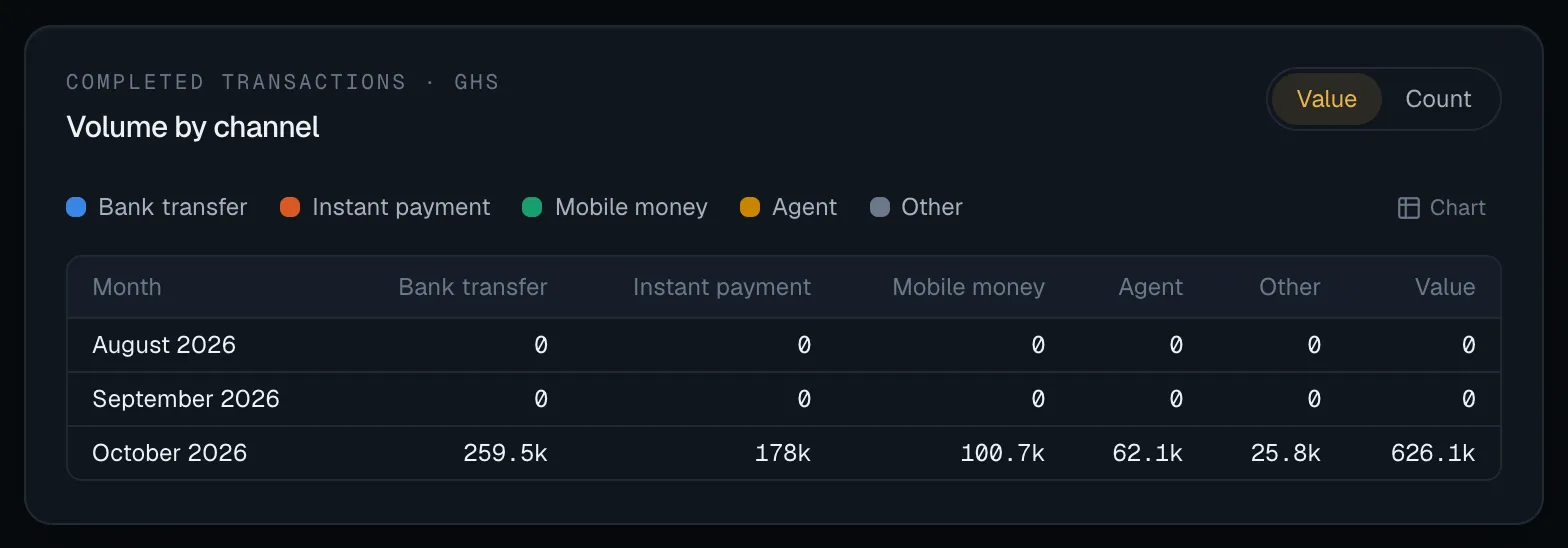
Table shows the same figures month by month:
By transaction type
Section titled “By transaction type”The same transactions over the whole period, ranked by type (transfer, payment, deposit and so on). The eight largest types are shown. It follows the Value / Count switch of the volume panel.
Typologies
Section titled “Typologies”Rule hits per month, stacked by the rule’s category: the letter families of the rule library, such as structuring or velocity. A hit by a rule with no category is shown as Uncategorised.
- Only live rules count. Hits from rules in shadow mode are left out.
- Every live hit counts, including a hit that an approved suppression kept from raising an alert. When there are any, the line above the title says how many: Rule hits by category · N suppressed.
This is the same count as the Rule performance panel below and the Command center’s rule figures, so the three agree. See Analytics API.
A category that grows month after month while your volume is flat is worth a look: either the behaviour is spreading, or a rule in that family has become too loose.
Rule performance
Section titled “Rule performance”The ten rules with the most hits over the period, most first. Under each rule:
| Shown | Meaning |
|---|---|
| The bar and its number | Hits by the live rule over the period: every live hit, shadow hits left out, suppressed hits included. It is counted the same way as in the Typologies panel |
| N suppressed | How many of those hits an approved suppression kept from raising an alert. Shown only when there are any |
| N% confirmed | Of the alerts involving this rule that were closed during the period, the share that were not closed as a false positive |
| no closed alerts | No alert involving this rule was closed during the period, so there is nothing to judge it by yet |
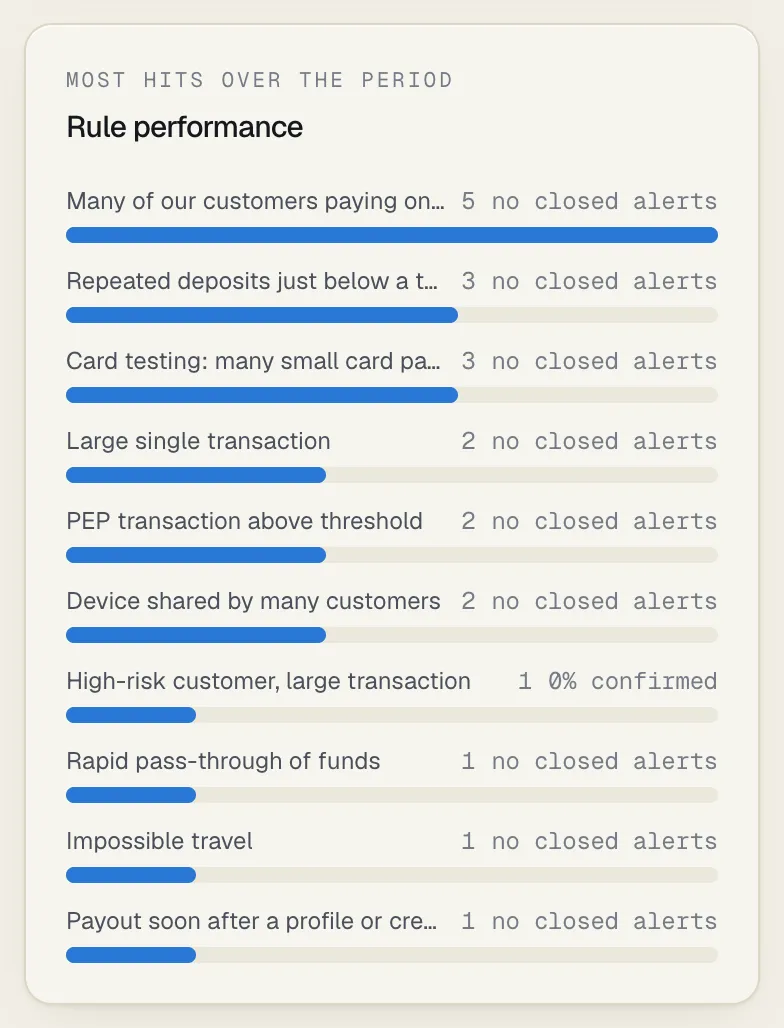
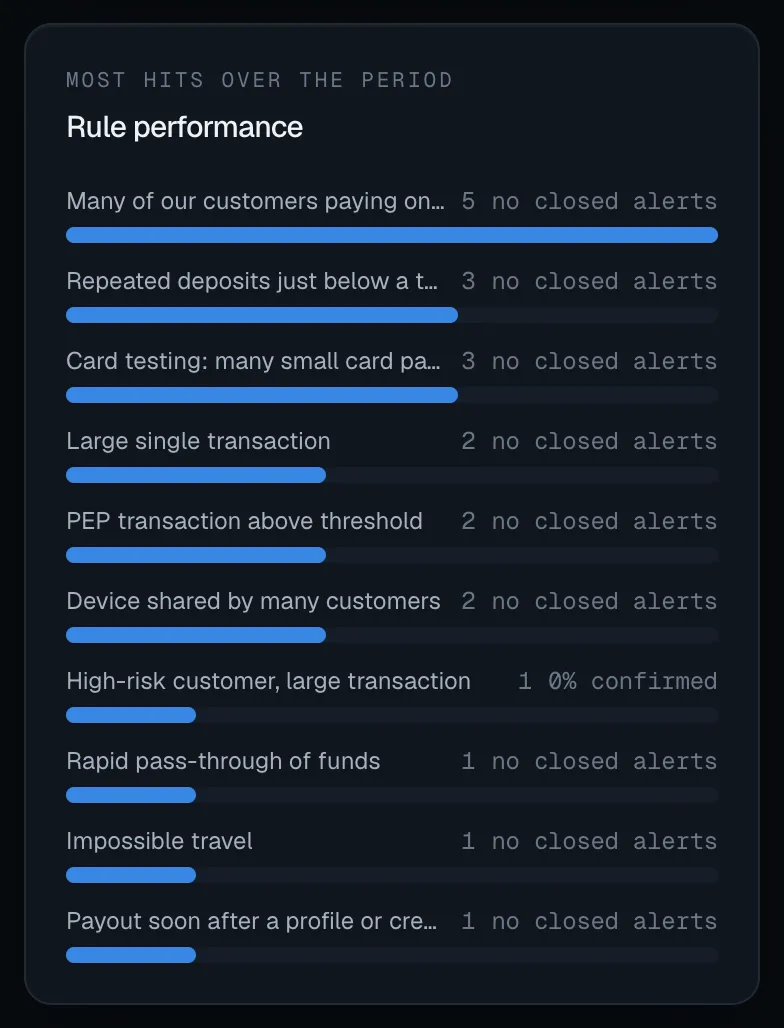
A rule with many hits and a low confirmed share is costing analysts time: it is the first candidate for tuning. An alert raised by several rules counts towards each of them.
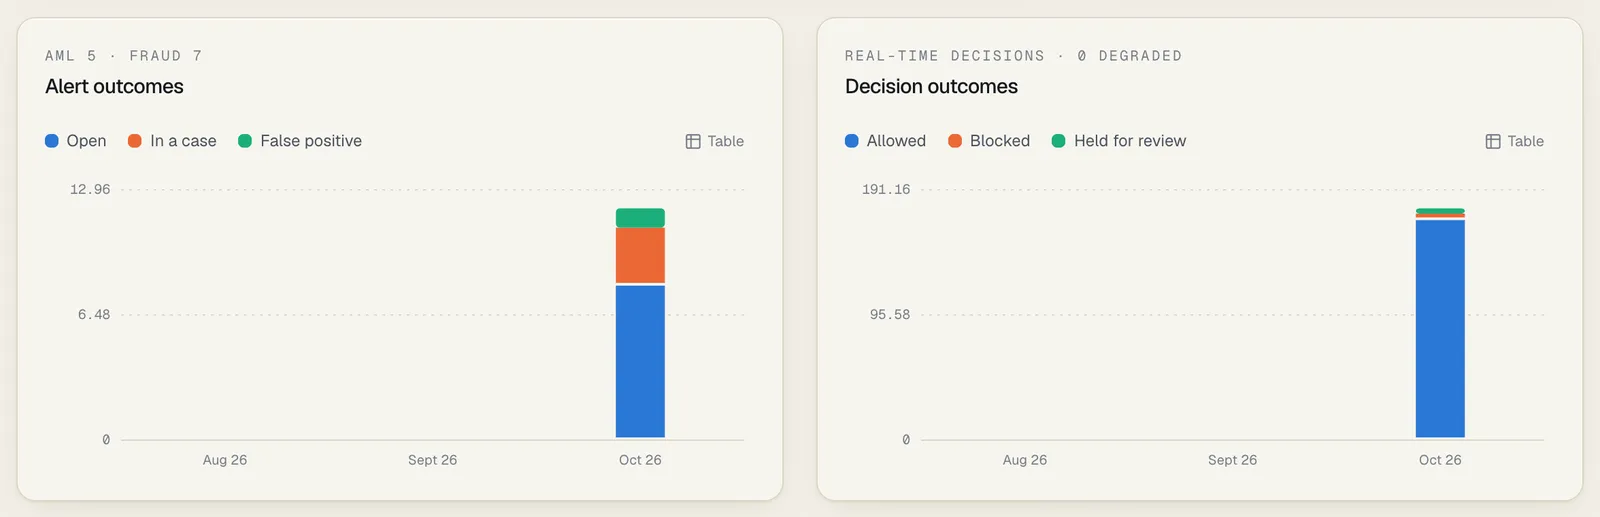
Alert outcomes
Section titled “Alert outcomes”Alerts by the month they were raised, stacked by where they stand now:
| Outcome | Meaning |
|---|---|
| Open | Still waiting in the alert queue |
| In a case | Being investigated in a case |
| False positive, No action needed, Duplicate, Escalated to a case | The disposition the alert was closed with. See Choosing a disposition |
| Other | Closed without one of those dispositions |
The line above the title gives the totals by kind of alert, for example AML 412 · Fraud 97.
Because alerts are placed in the month they were raised, an old month’s bar changes as its alerts are closed. A month from a year ago that still shows Open alerts points at a backlog.
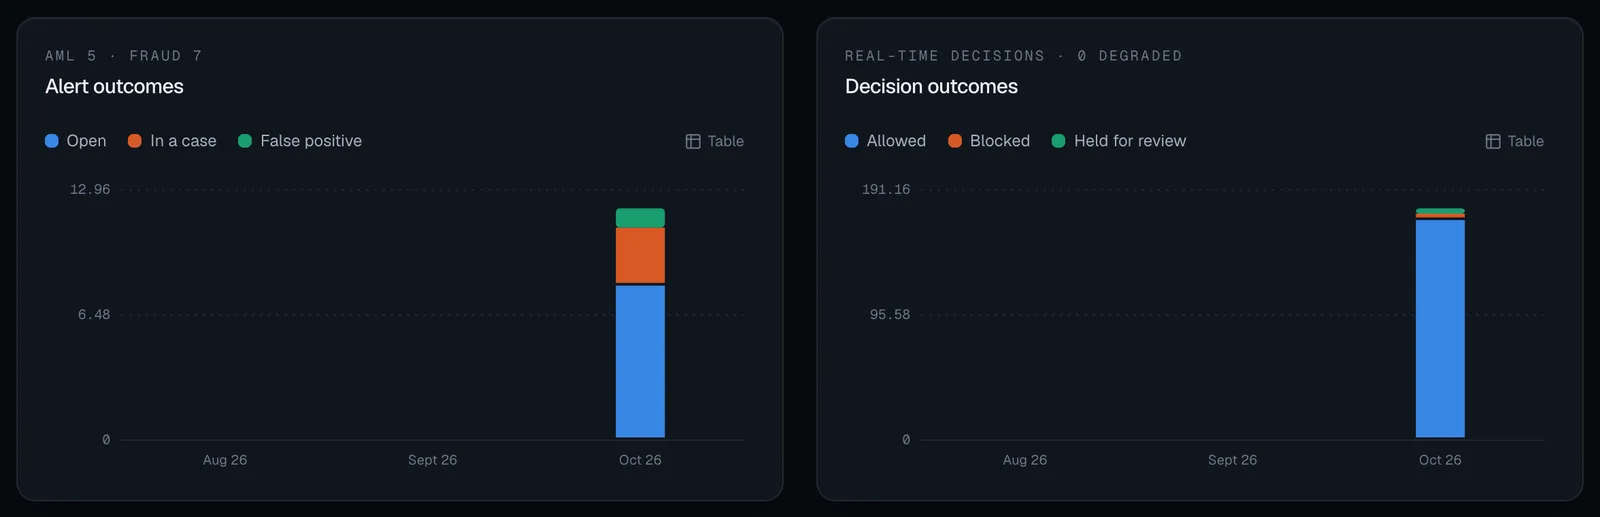
Decision outcomes
Section titled “Decision outcomes”Real-time decisions per month, stacked by answer: allow, step up, review or block. The line above the title says how many were degraded, that is, answered by the workspace’s failure policy because SpeculaPro couldn’t finish in time. A rising degraded count is something to raise with whoever runs your installation.
A workspace that doesn’t use the decision API sees Nothing in this period yet.
How far back you can look
Section titled “How far back you can look”The page reads from one of two places:
- the main database, which always answers, for the last 3 months;
- the analytics store, an optional second database built for long-period questions, for up to 24 months. Whoever runs your installation sets it up, not the web app. If you are that person, see Analytics store (ClickHouse).
SpeculaPro uses the analytics store only when it holds your workspace’s history completely enough and is up to date. When it can’t, the page answers from the main database instead of showing an error or a short count. Either way the figures for the months shown are the same.
The period buttons
Section titled “The period buttons”- The pressed button is the period shown. It is never a period the page can’t give you. On the main database that is 3 months, not a greyed-out 12.
- Longer periods are greyed out, and their tooltip gives the reason.
- If the analytics store holds only part of your history, the page offers the whole months it does hold when that is more than 3 months. For example, 6 months is offered and 12 and 24 are greyed out. With 3 months or fewer, the page reads the main database.
What the line under the title means
Section titled “What the line under the title means”N is the number of months shown.
| The page says | What it means | What to do |
|---|---|---|
| Read from the analytics store: the last N months, the current one included. | The analytics store answered. You can choose up to 24 months | Nothing |
| Read from the analytics store, which holds this workspace’s history for the last N months only: longer periods aren’t available. | The analytics store answered, but it holds your history from a certain date only | Ask your administrator to copy the rest |
| Read from the main database, so limited to the last N months. Longer periods need the analytics store (ClickHouse), which your administrator can connect: it shows up to 24 months. | Your installation has no analytics store | Nothing, unless you need more than 3 months: then ask your administrator |
| Read from the main database, so limited to the last N months. The analytics store is connected, but this workspace’s history hasn’t been copied to it yet; longer periods become available once your administrator has run that copy. | The store exists, but your workspace’s past transactions were never copied into it | Ask your administrator to run the copy |
| Read from the main database, so limited to the last N months. This workspace’s history is being copied to the analytics store; longer periods become available when the copy has finished. | A copy is running | Wait, and reload later |
| Read from the main database, so limited to the last N months. The analytics store holds only this workspace’s most recent history, so it has no longer period to offer yet. | The store holds 3 months or less of your history, so it can’t show more than the main database | Ask your administrator to copy the rest |
| Read from the main database, so limited to the last N months. The analytics store is behind at the moment; longer periods come back once it has caught up. | The store is more than 15 minutes behind live | Reload in a few minutes. If it stays that way, tell your administrator |
| Read from the main database, so limited to the last N months. The analytics store can’t be reached at the moment; longer periods come back when it can. | The store didn’t answer | Reload in a few minutes. If it stays that way, tell your administrator |
What the figures don’t include
Section titled “What the figures don’t include”- The most recent minutes, when read from the analytics store. The store is filled a little after the main database: normally seconds, and the page stops using it once it is more than 15 minutes behind. For up-to-the-second figures use the Command center.
- Customer names or any personal details. The page shows totals only. To see who is behind a figure, use the alert queue, Transactions or Rules.
- Months before your data starts. Empty months are shown as empty bars, not left out.
- A download. There is no export button. Use the table view, or the Analytics API, which returns the same figures as JSON.